Urban Forest Visual
How do you communicate the issues facing an Urban Forest using data?
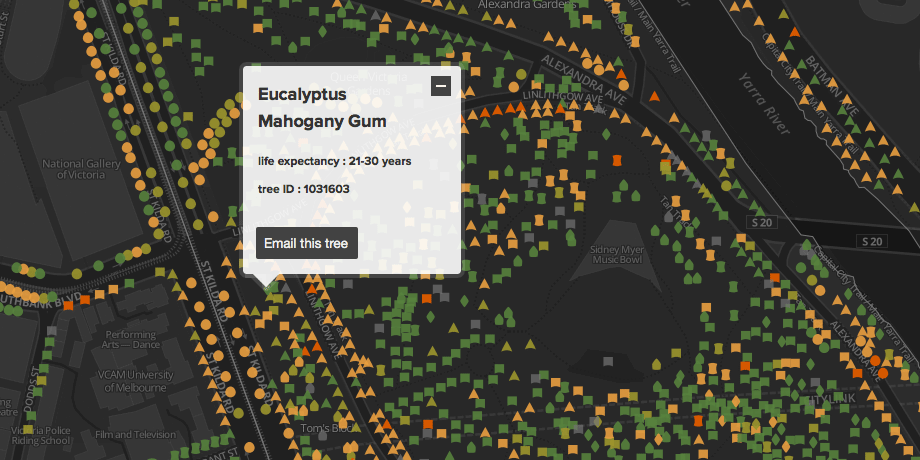
We continue to work with the City of Melbourne on a project that provides a digital platform to communicate the central issues of the Urban Forest. Key to this platform is an interactive health map for ever tree that the City of Melbourne manages, that enables citizens to quickly see the state of their favourite tree in terms of life expectancy.
Visit melbourneurbanforestvisual.com.au

Melbourne’s Urban Forest
As a city Melbourne has benefited from visionary planting of treed avenues and parks in the late 19th century. However these trees - over a hundred years later - are now coming to the end of their life cycle. Compounding this historical condition with prolonged droughts, and potential changes in climate, the urban forest is an important city asset requiring a strategic long term approach to its management (link to strategy).
Process & Approach
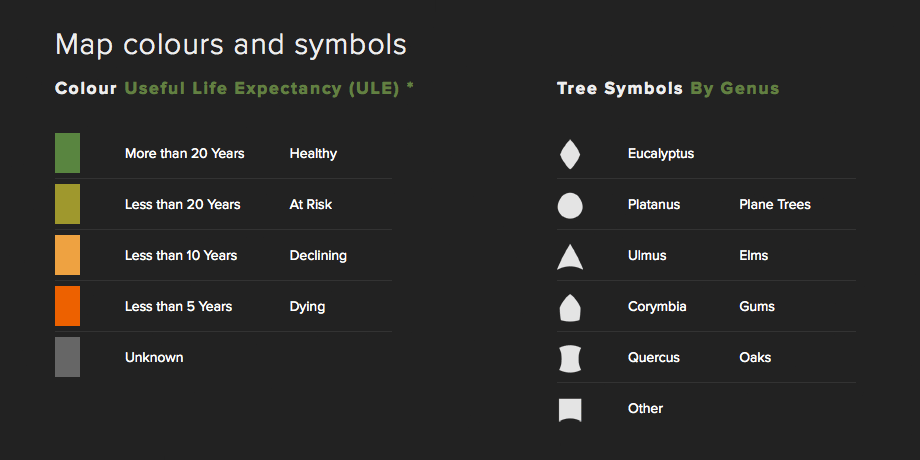
Our challenge was how best to show the trees as a resource and examine opportunities to convey key messages of the urban forest strategy through data visualisation. After a scoping phase with the urban forest team, which examined and tested data visualisation opportunities, it was decided to focus on a public interactive map that could also be part of the public consultation workshops. What is unique with the Melbourne tree dataset is that it’s based on a total tree audit: where the conditional of the city trees was assessed for their useful lifetime expectancy. This unique set of information gave the tree data an obvious lens to visualise the data through, and we utilised a colour range to indicate tree lifetime expectancy - or health - and this shows at a glance what trees in the city are at greater risk.

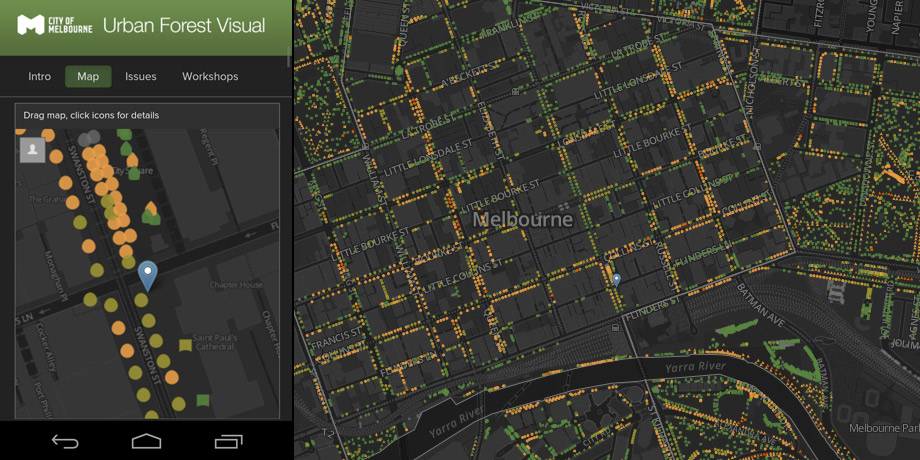
Along with colour, distinctive icons were developed for the main tree types (by genus). At a glance one can see the difference or similarity in a group of icons on the map, and in combination with the colour scheme, a viewer can quickly ascertain what areas of the urban forest might be at risk, and whether that risk pertains to a certain type of tree. This is very helpful when walking through the city and viewing the map on a mobile phone - as you get an immediate visual presentation relative to your geo-location of the surrounding tree life expectancy and diversity.

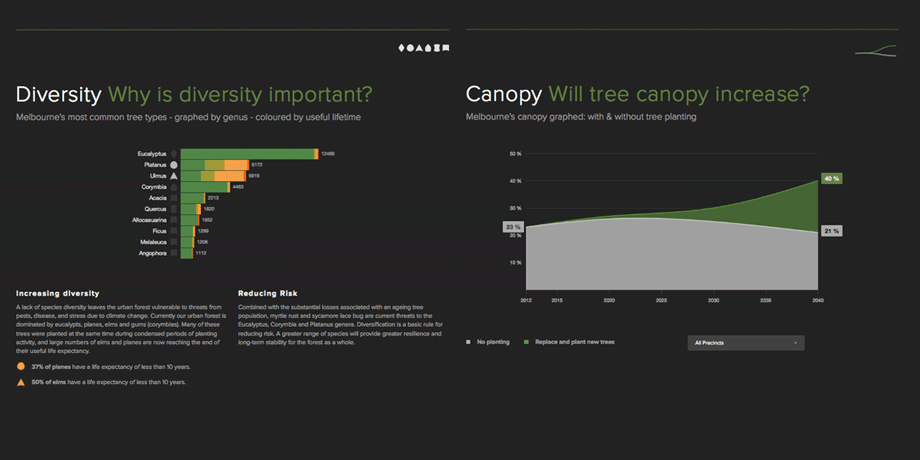
The website also contains stacked graph visualisations of tree types (Genus) and an animated graph for future projections of the canopy within the city adjustable for different precincts.

Project Team
Visualisation, UX and implementation: OOM Creative, Miek, Nice Device
