Breaking Down Barriers
Visualising lengthly data
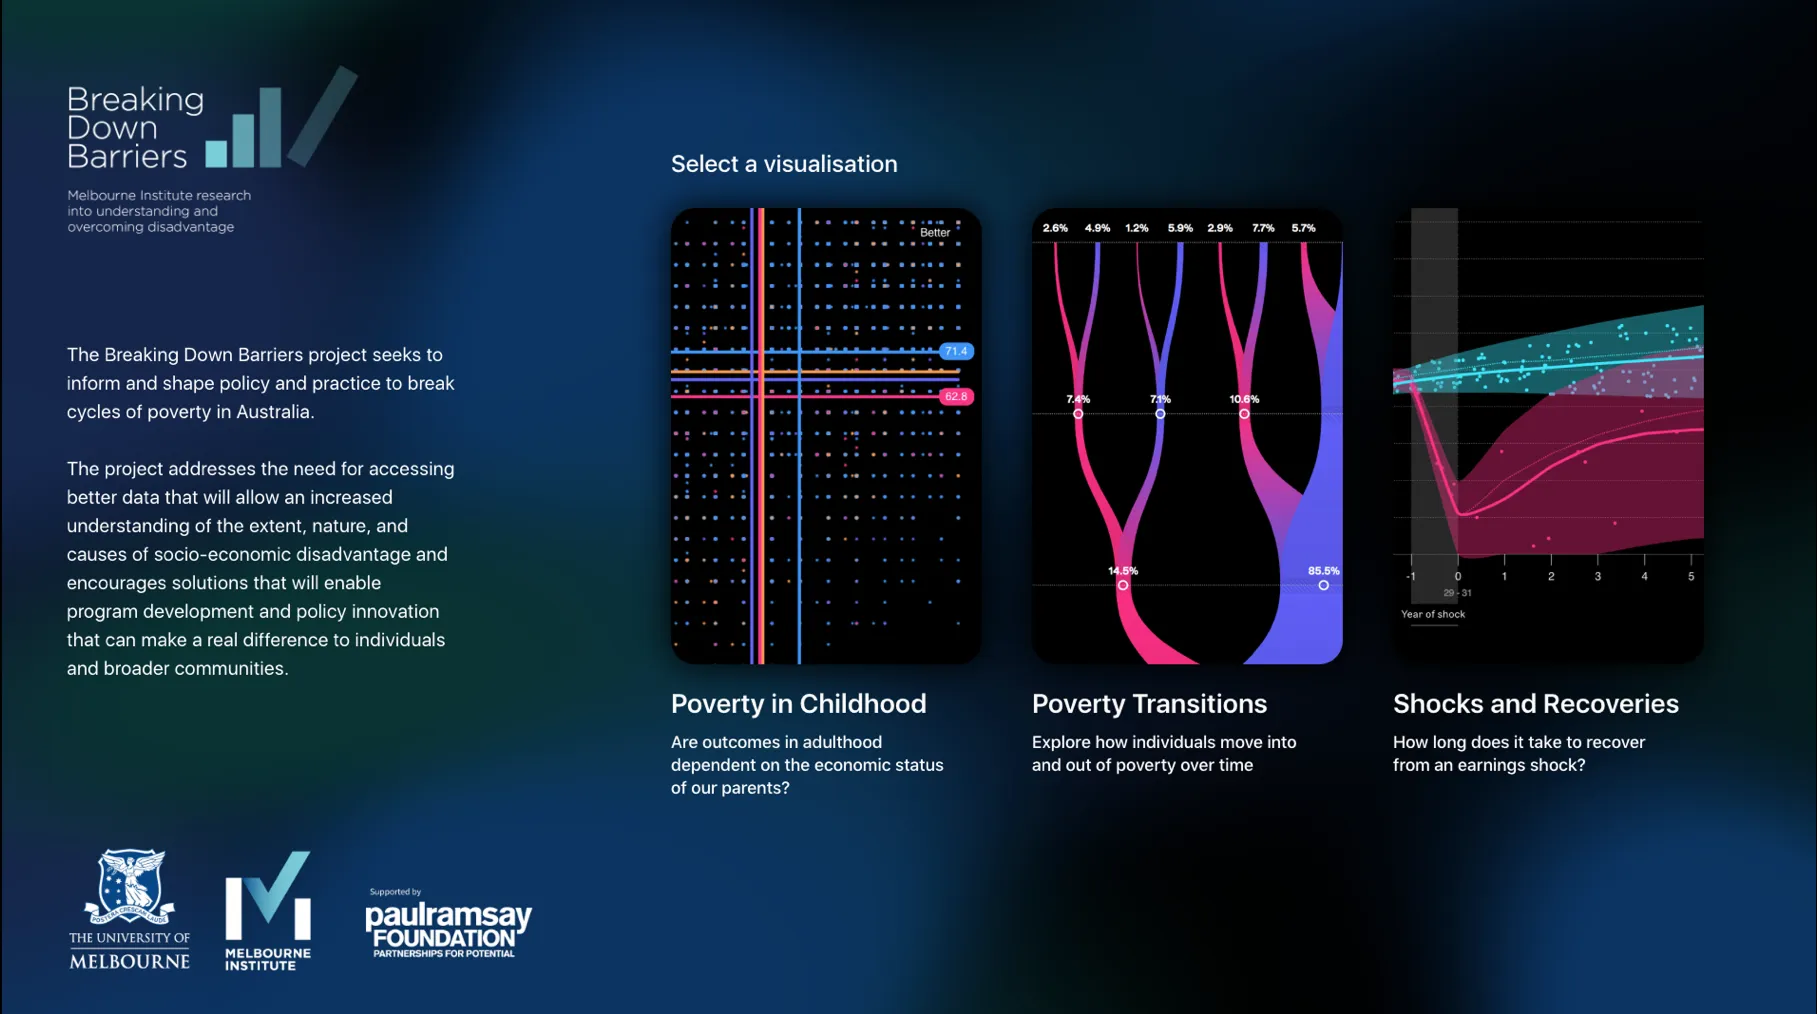
Project with Melbourne Institute to create 3 interactive visuals for touchscreen and web interactions. These visuals worked with a range of datasets and research to showcase research outcomes. Animated, inactive, designed for people of better understand the research findings, or be used by staff for conference & stakeholder presentations.
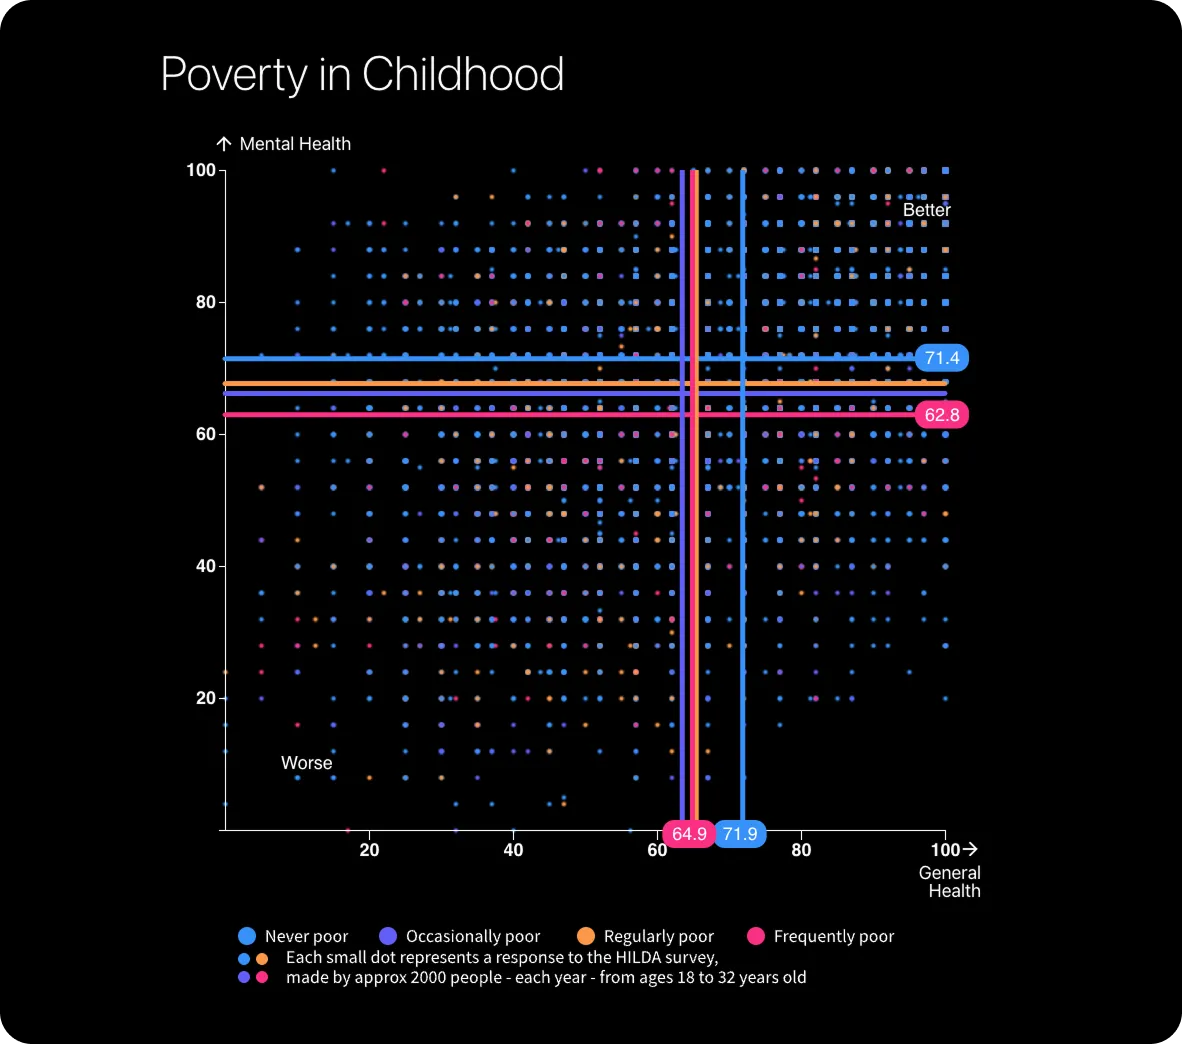
Poverty in Childhood
Experiencing poverty as a child can significantly increase the likelihood of socio-economic disadvantage in young adulthood.
Using the HILDA data, explore how different levels of poverty in childhood affects education, employment and health outcomes later in life.
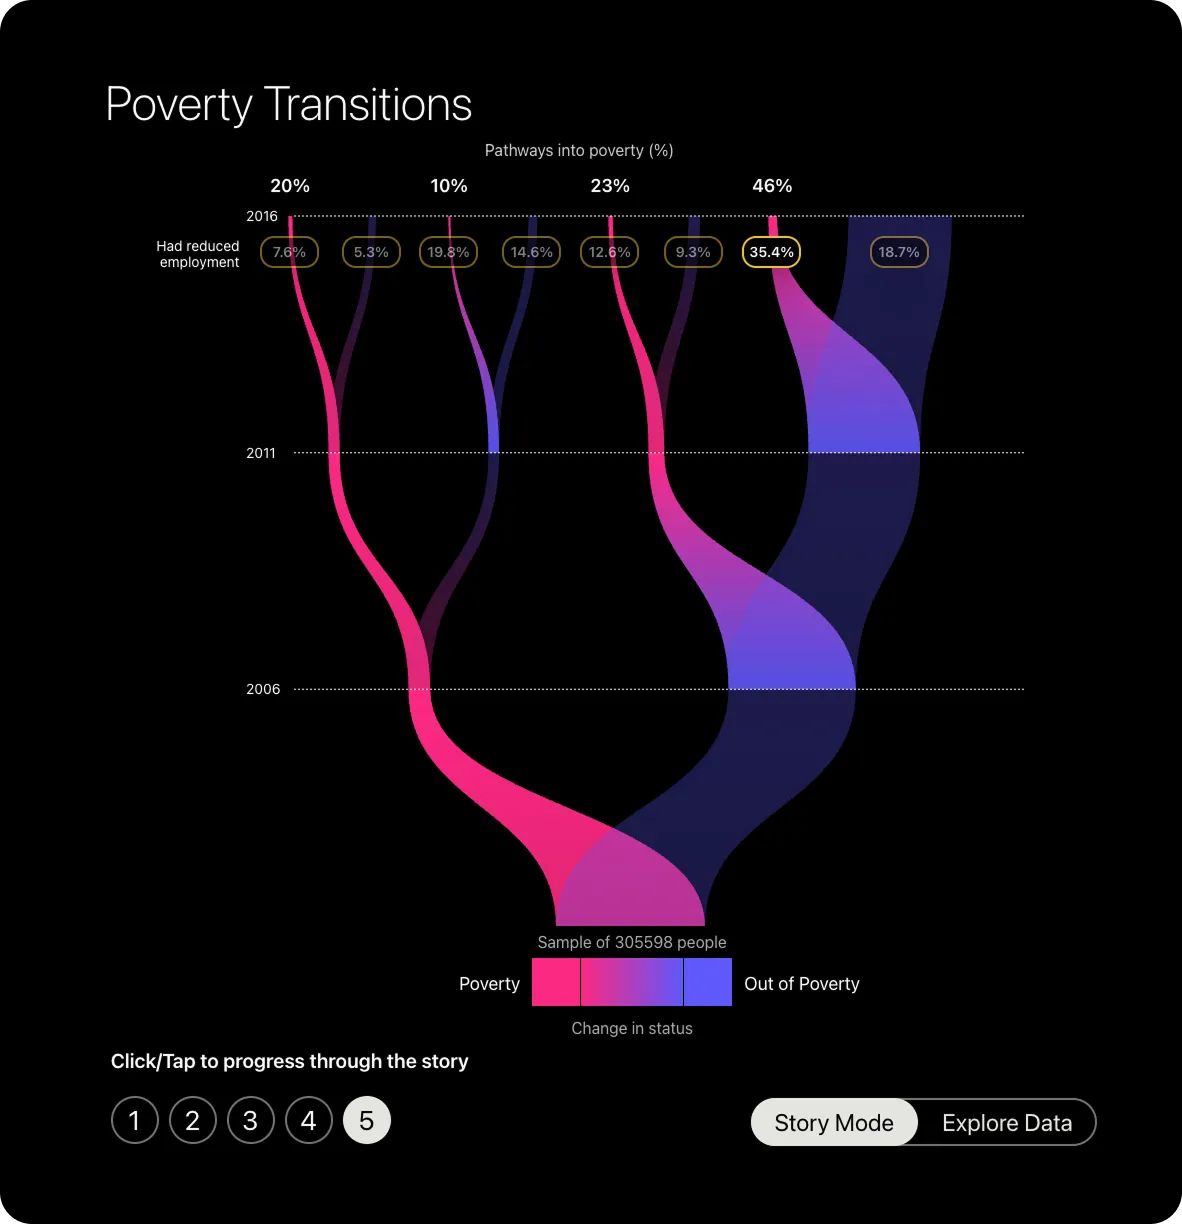
Poverty Transitions
Understanding why people move into poverty, and more importantly, how they move out is critical to breaking the cycle of disadvantage.
Explore the data to see how age, changes in employment status, education and family situations can all affect someone’s likelihood of entering or exiting poverty.
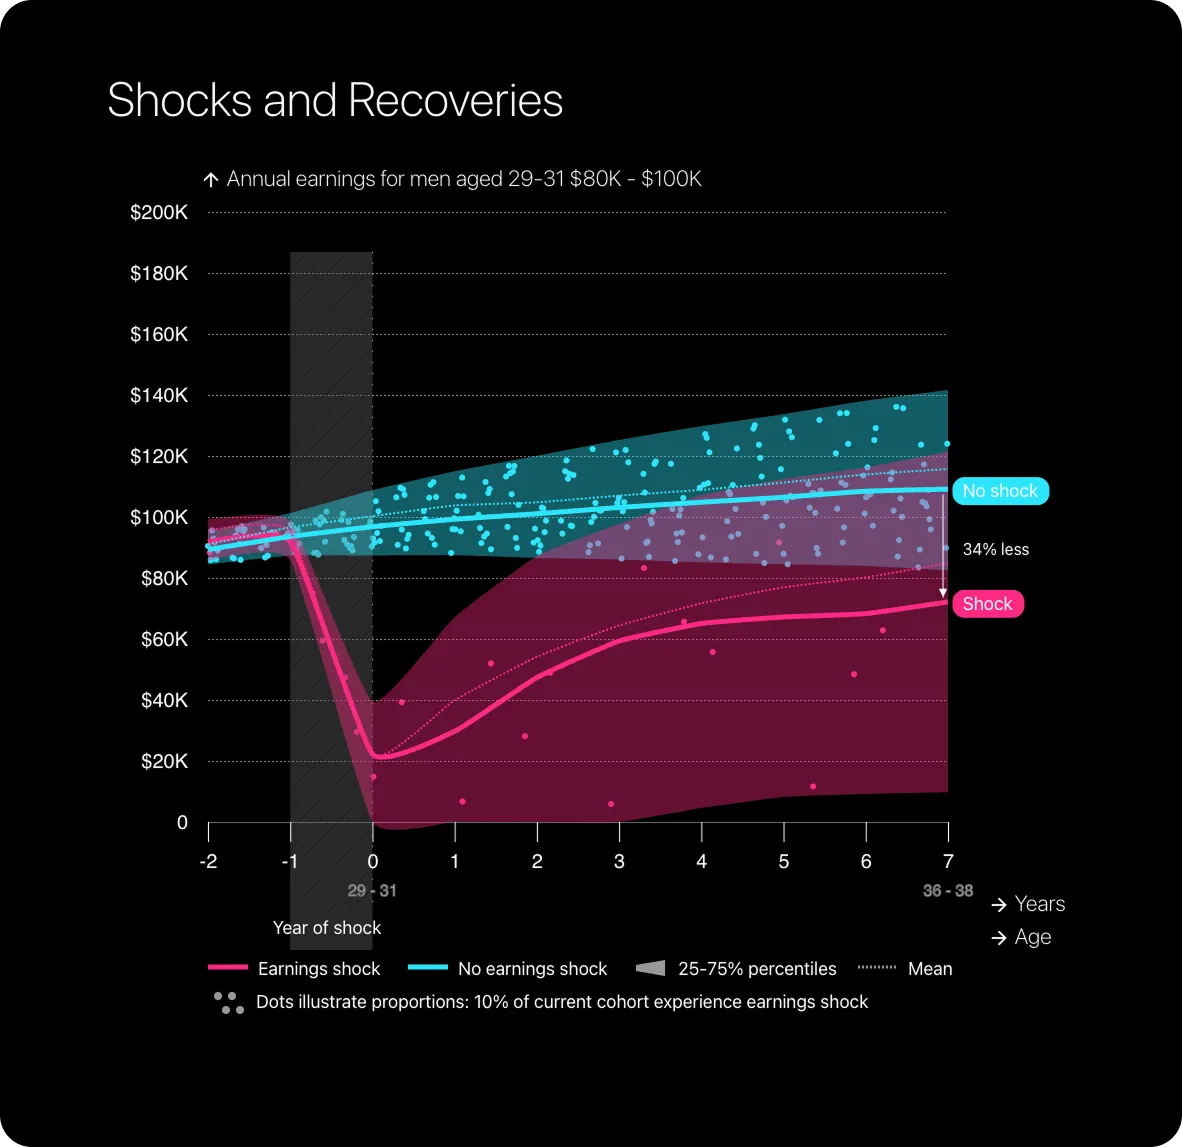
Earnings Shocks and Recoveries
Many people experience and recover from earnings shocks each year. While some people recover relatively quickly, for many, it can take years.
Explore the data to see how different factors such as age, gender and pre-shock earnings can influence how an individual recovers from shocks in comparison to those who have not experienced an earnings shock.