Featured
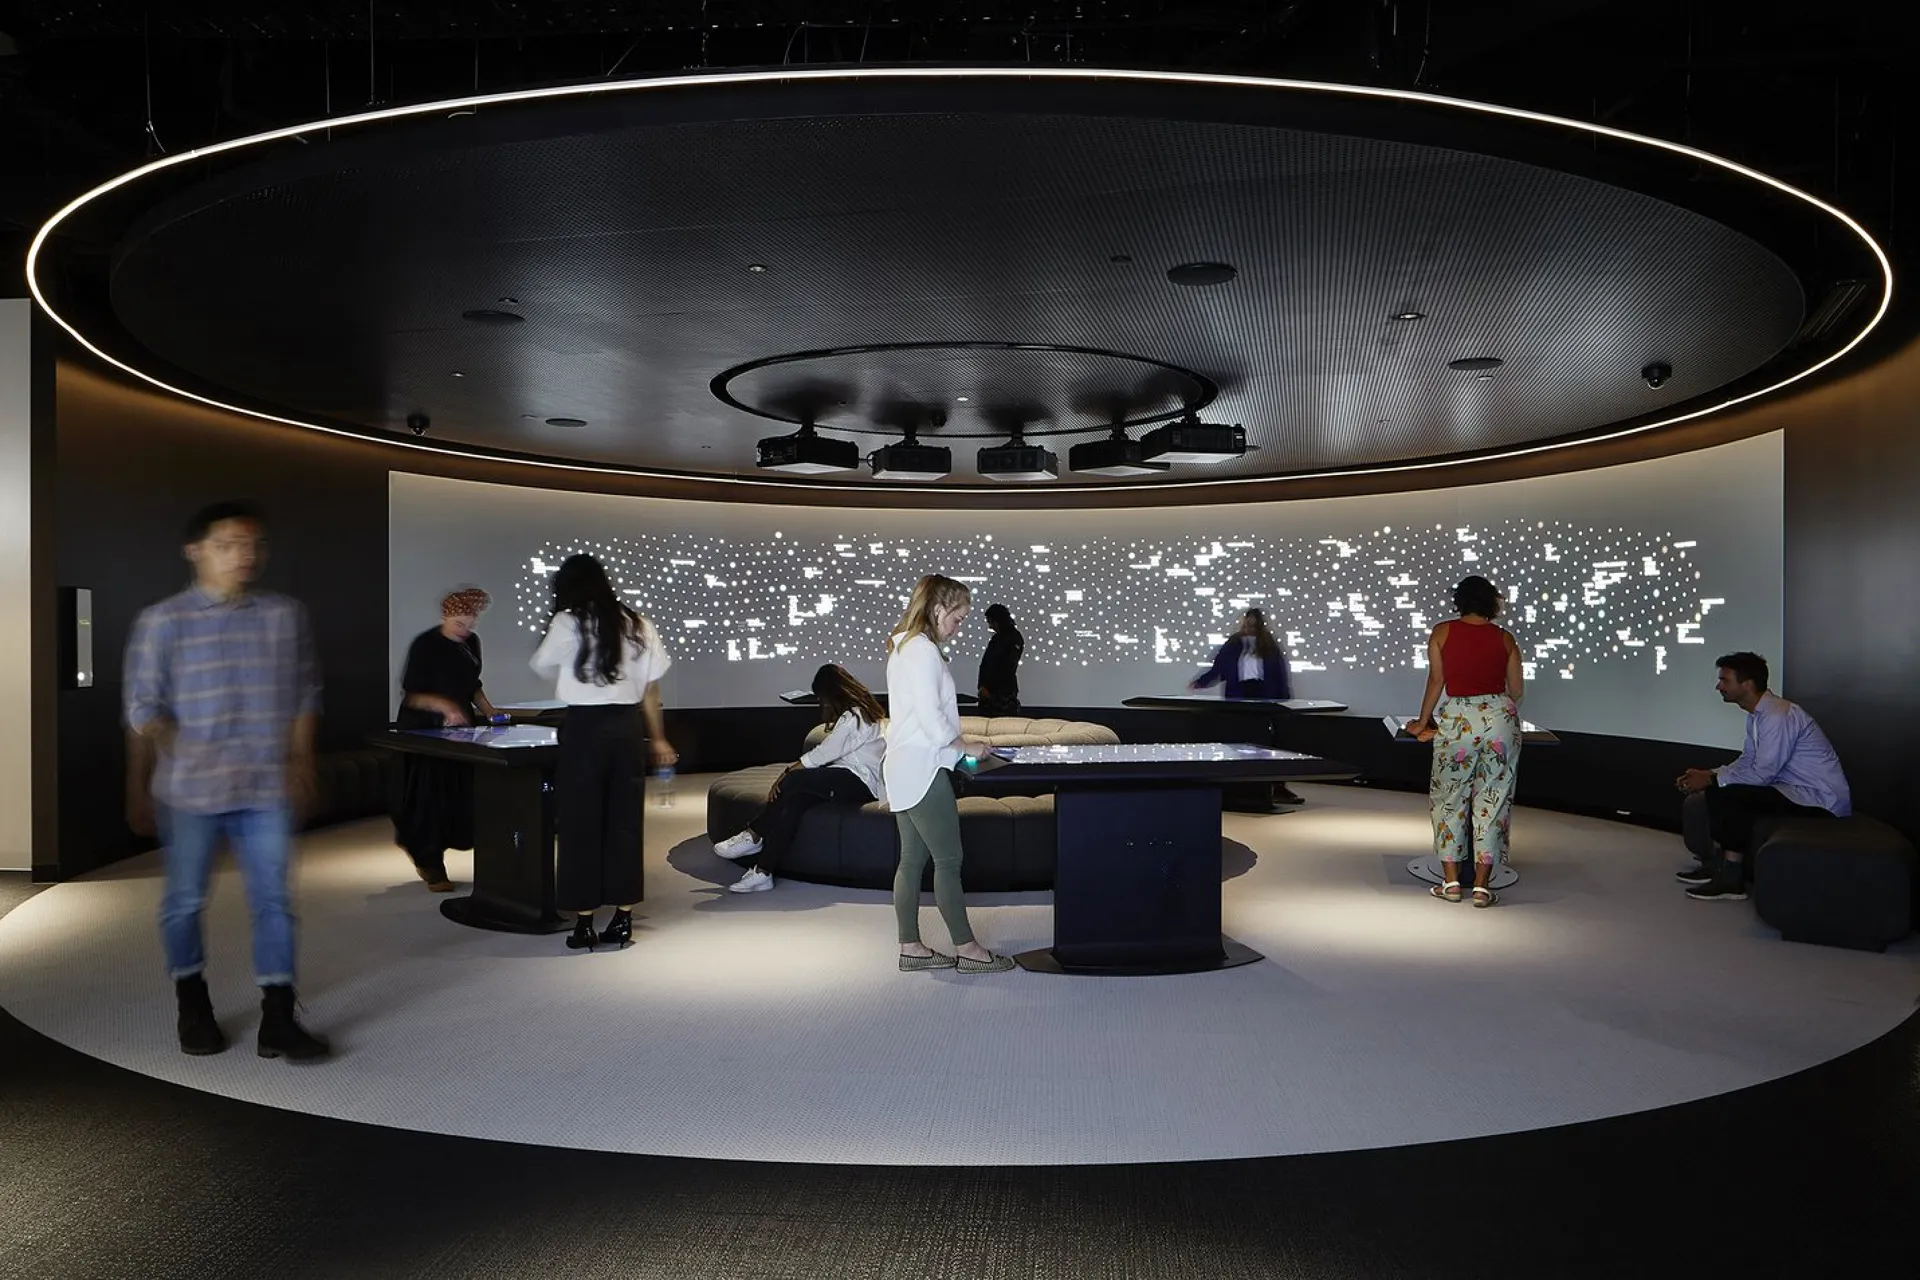
Living City
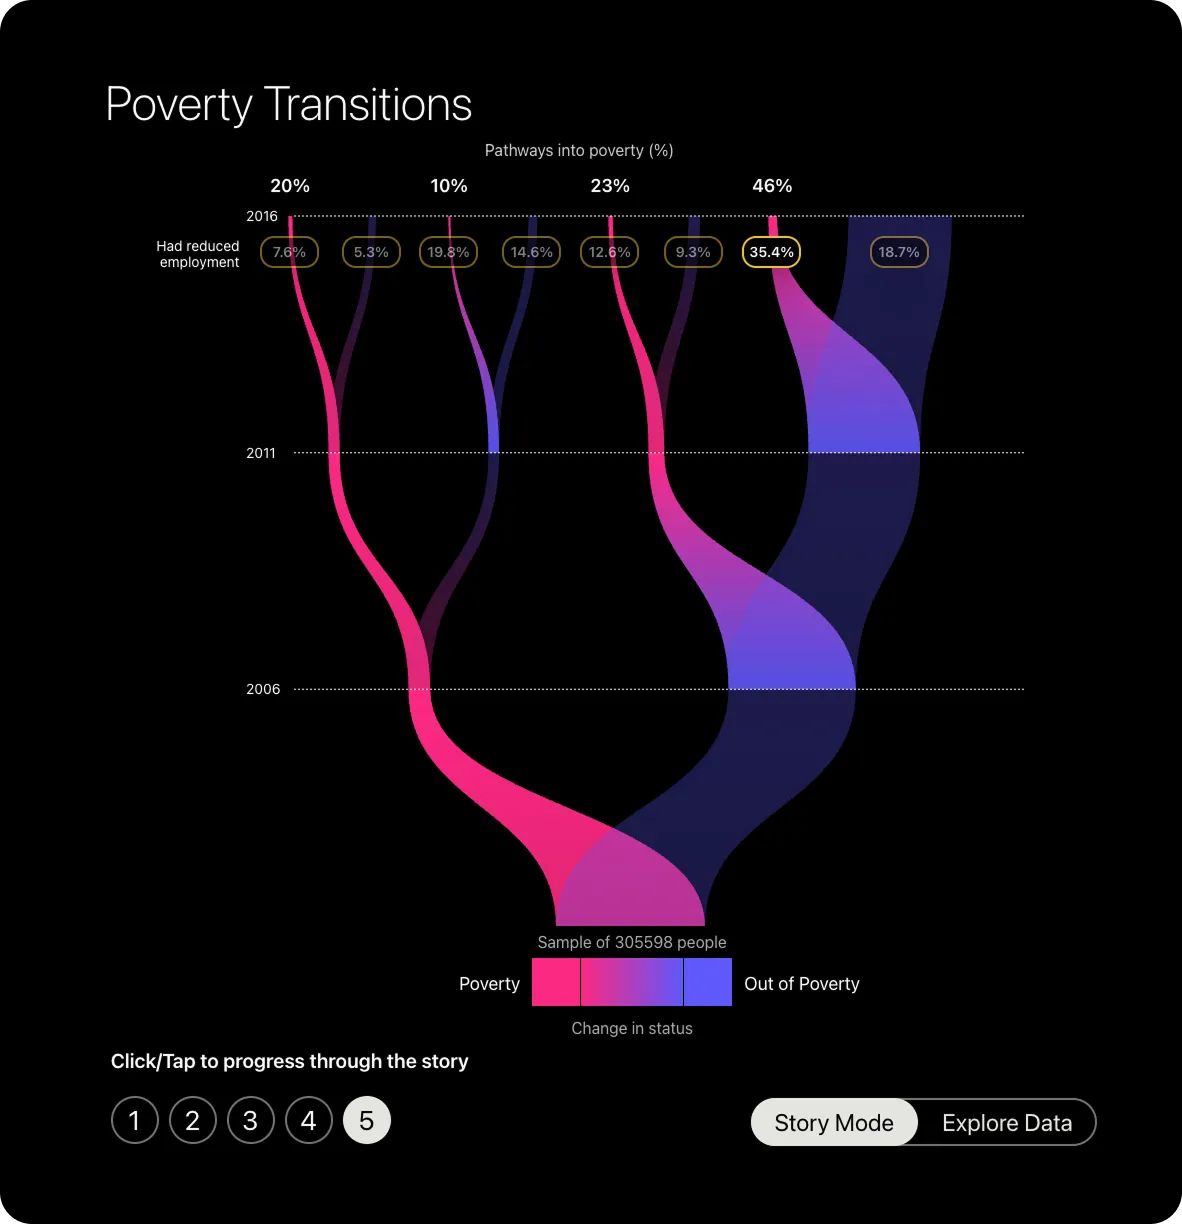
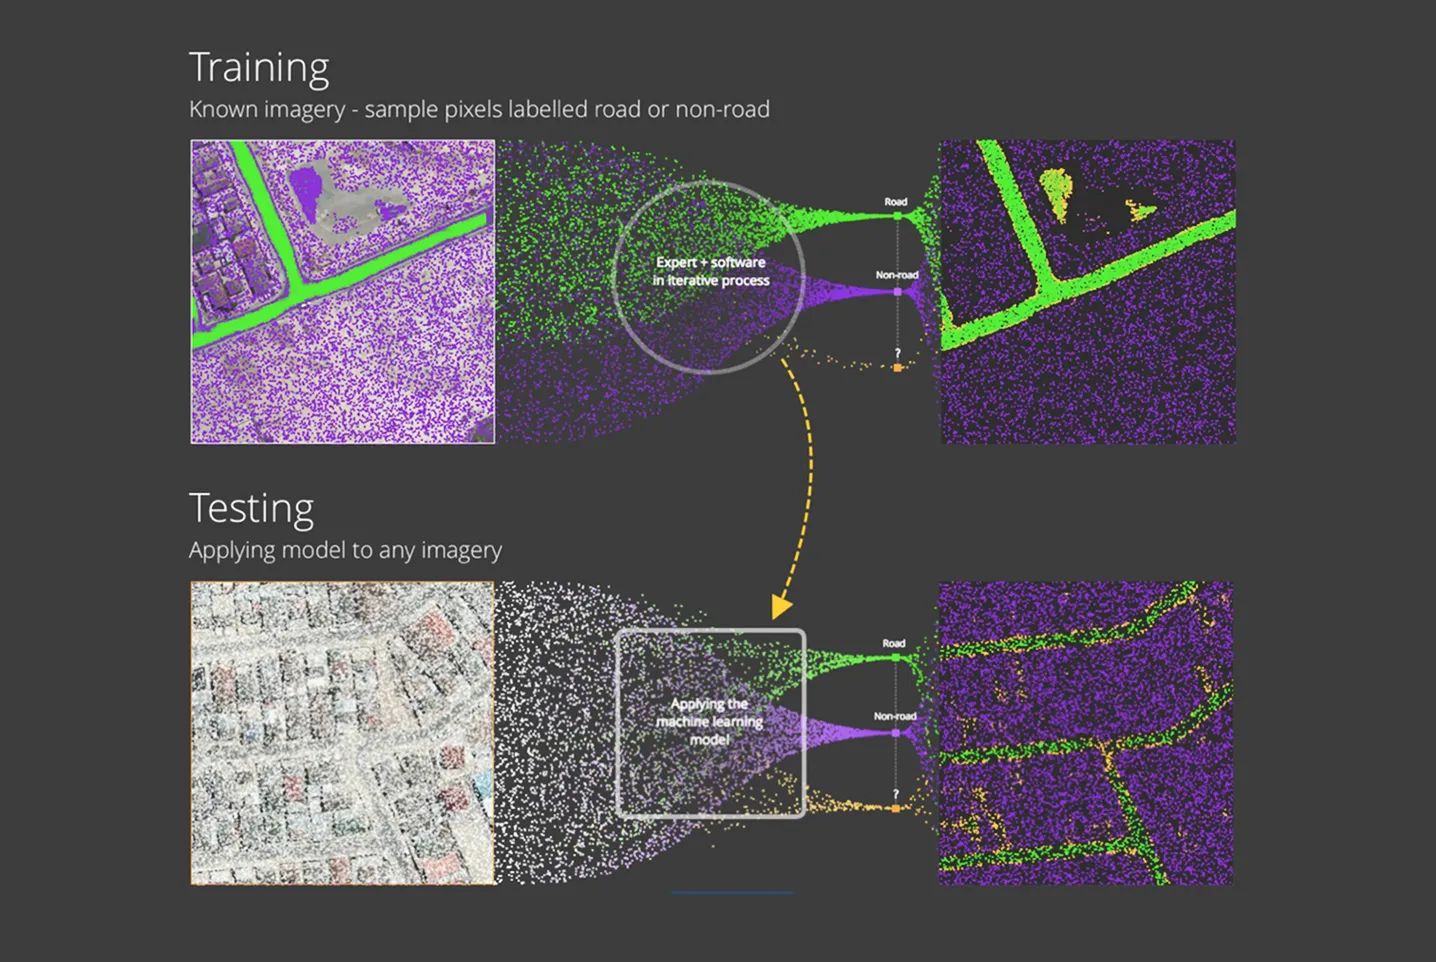
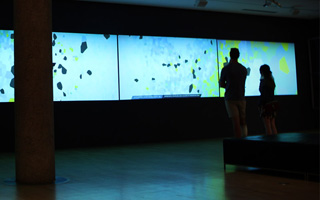
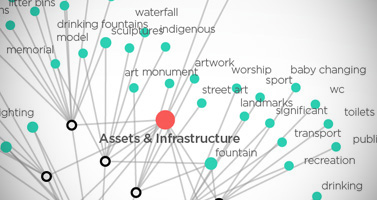
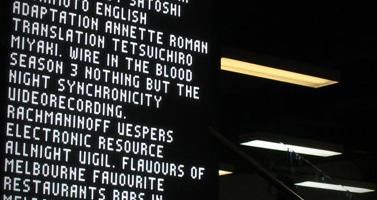
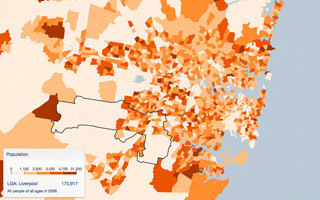
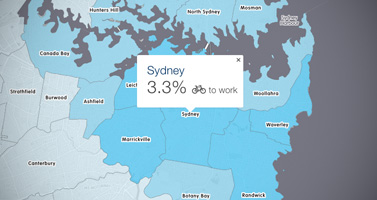
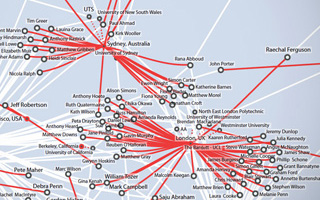
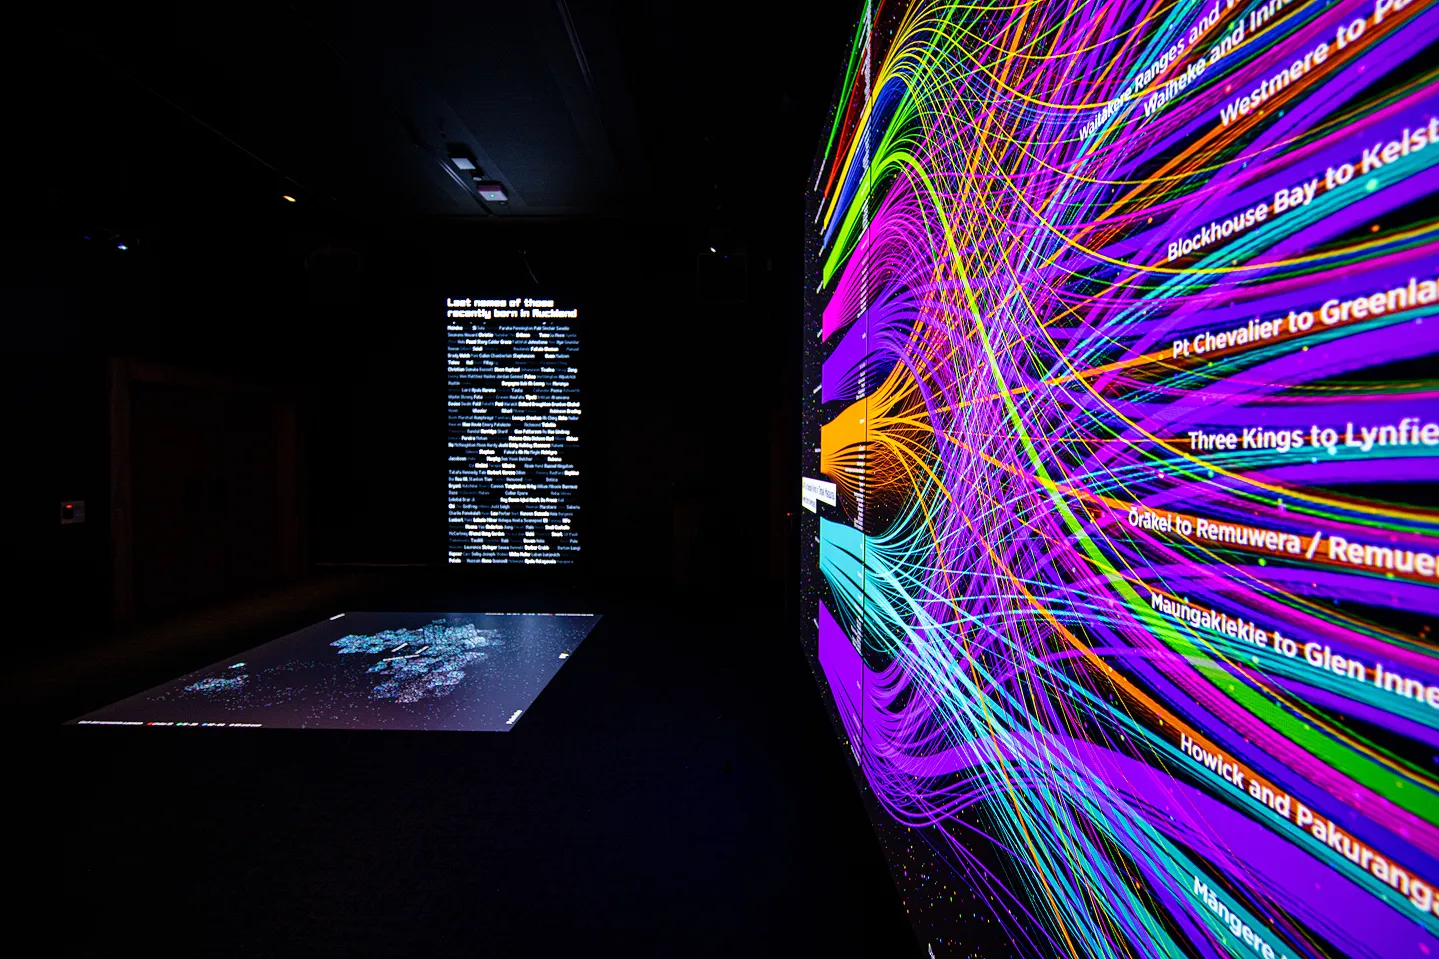
An immersive data installation at the Auckland War Memorial Museum transforming millions of data points into a visual portrait of Auckland's people, places, environments, and systems.
Installation Exhibition Data Visualisation Interactive