Virtual World Exhibition Metrics
Data visualisations for the National Portrait Gallery's virtual world exhibition — providing insight into how 48,000 data points reveal visitor behaviour patterns across a Second Life installation.

OOM Creative worked with the National Portrait Gallery, Canberra, on a series of data visualisations derived from metrics data of their virtual world exhibition.
With over 48,000 points of information collected through the Maya Realities metrics service, OOM Creative took the raw data and generated visuals to enable the exhibition curator to present the success of the exhibition — weekly and daily visitor numbers, return visitors, accumulation of visitor time, number of artworks visited, and more.
From these we can report that the average visitor to Portrait Island would spend around 25 minutes in the exhibition space, and generally visit all five artworks in that time. We can also correlate from the visualisations that a shared experience of the exhibition — people visiting at the same time — increases the length of a visitor’s stay.
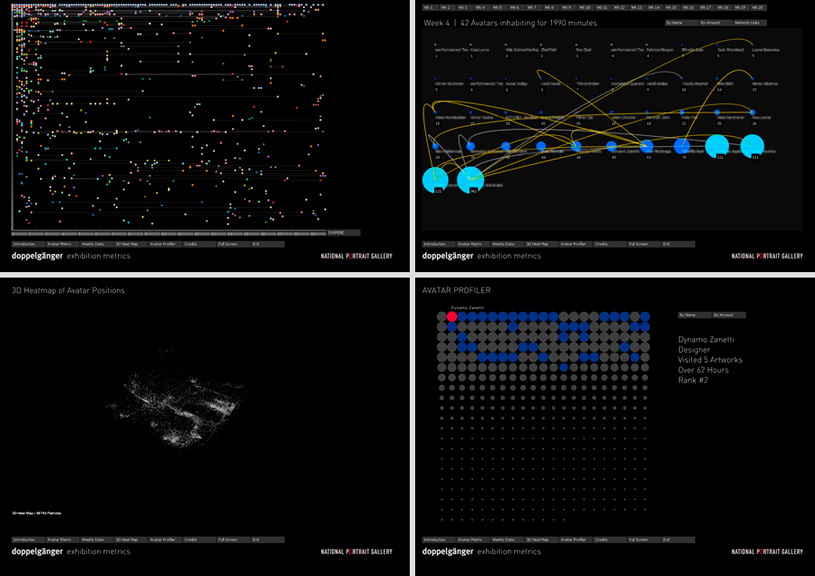
Interact with a sample of weekly data →
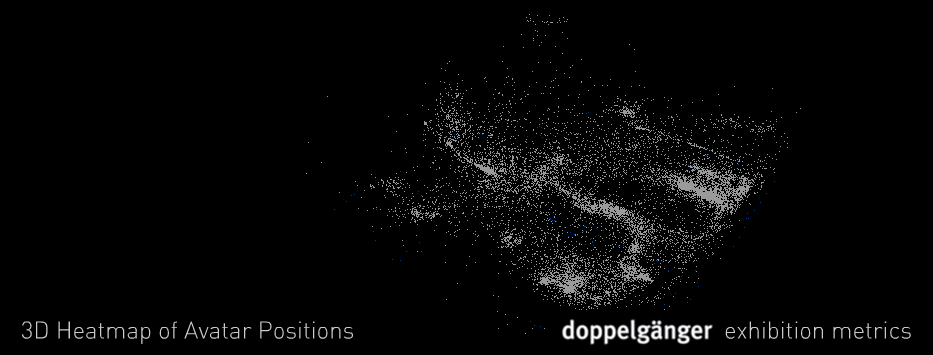
These web-based interactive visualisations show who was there, for how long, and who they came in proximity with (the social network of Second Life). There is also a 3D heatmap showing the positional data of the avatars. Each avatar has been given an anonymous name for privacy, and the data has been altered and reduced from the actual recorded Second Life activity.