Transport & Population Visualisations
In partnership with Arup, a suite of seven interactive visualisation interfaces for the NSW Bureau of Transport Statistics — making state transport data accessible to planners and the general public.
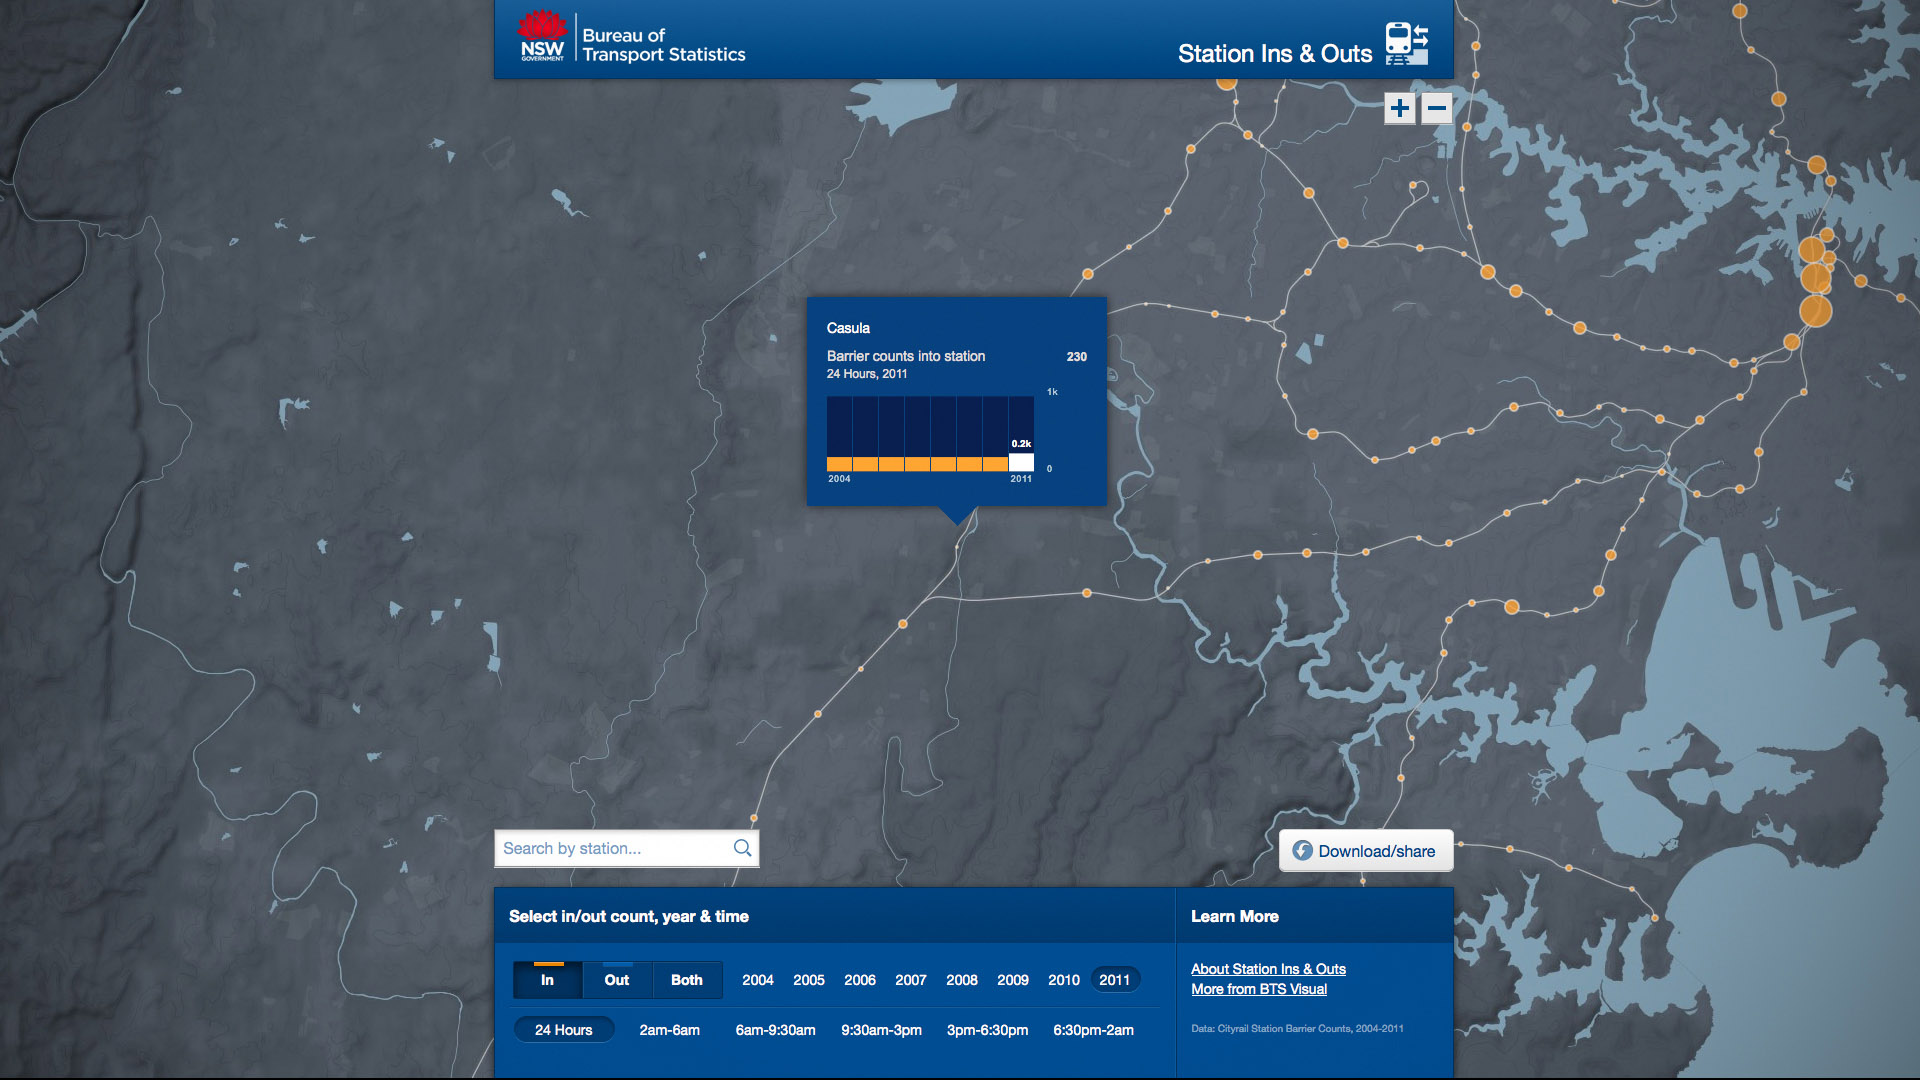
OOM Creative — in partnership with Arup — developed a suite of new data visualisation interfaces for the NSW Bureau of Transport Statistics (BTS).
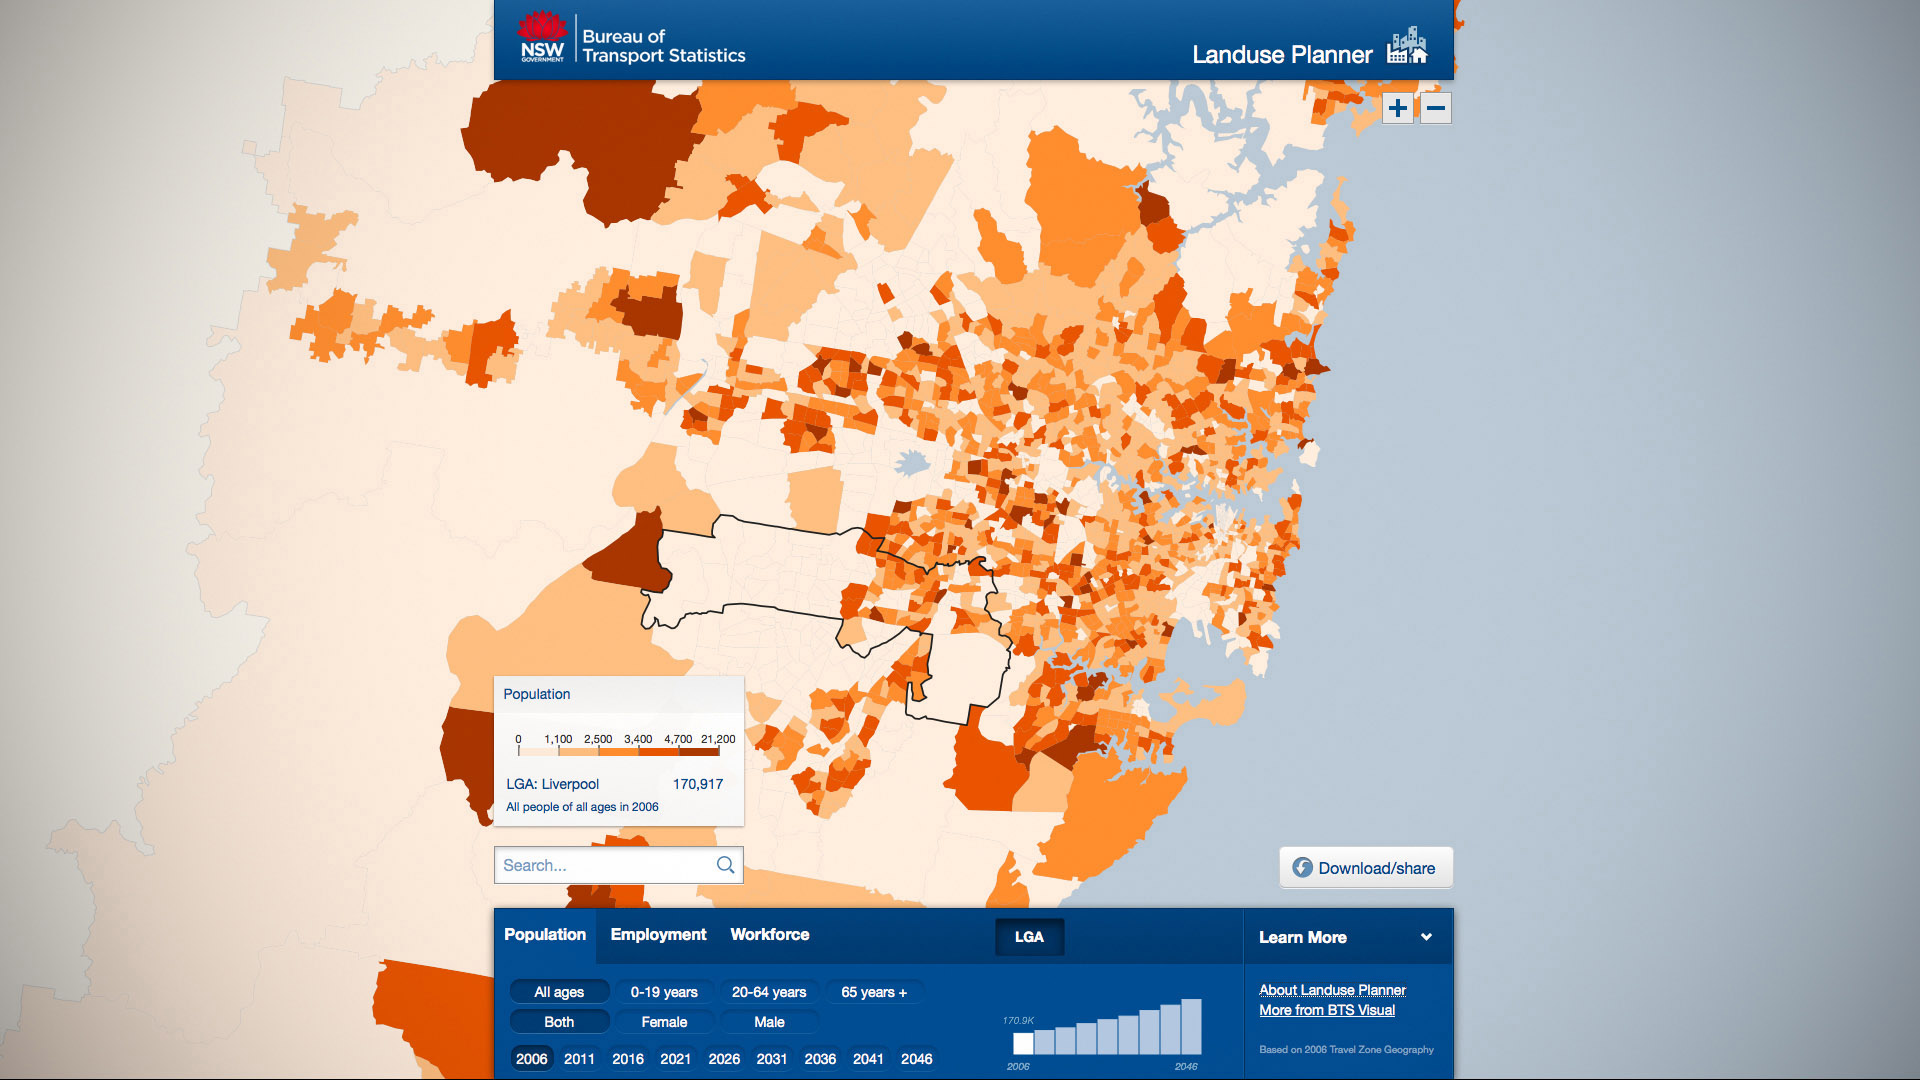
This project released seven interfaces to explore BTS datasets that had traditionally been supplied as spreadsheets or static maps in PDFs. These interactive visual tools are designed to be useful for planners and transport experts, as well as accessible and utilised by the general public.
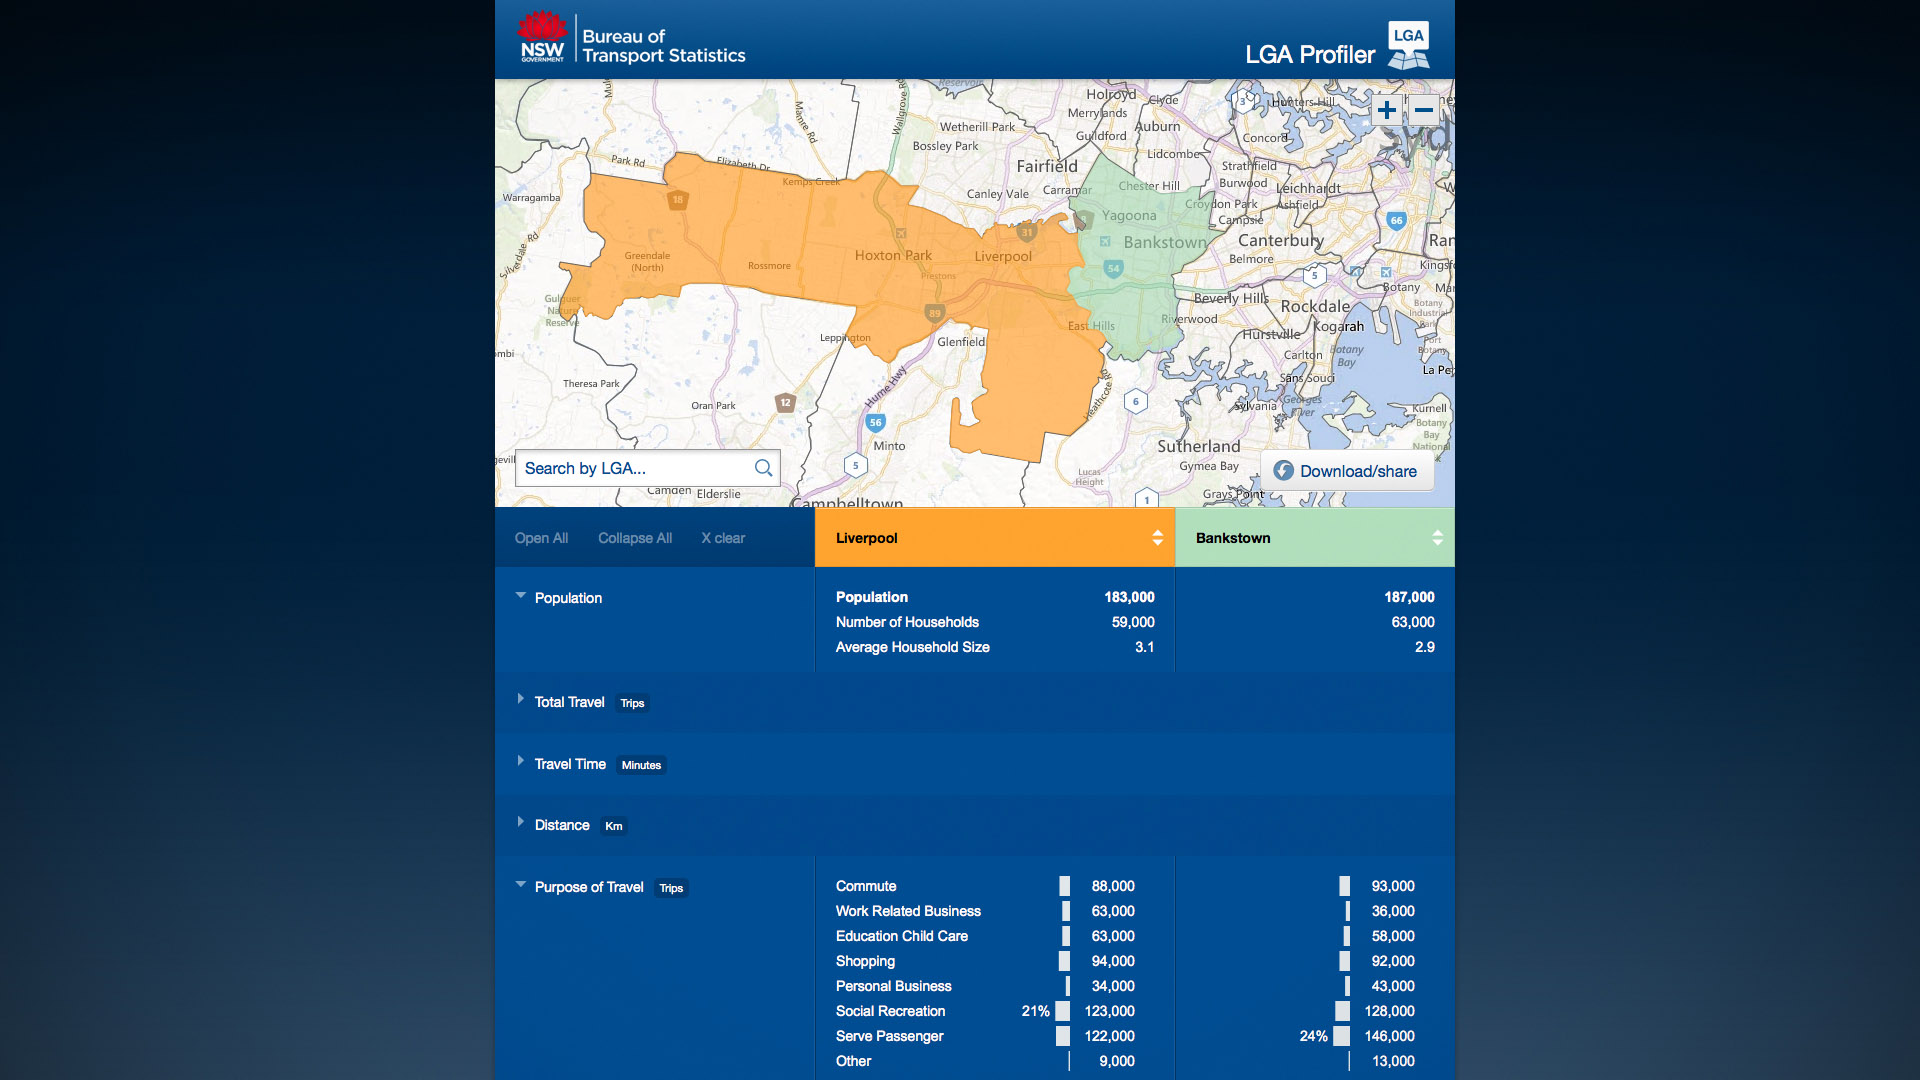
The interfaces range from finding data for specific locations through to more complex presentations via thematic maps and interactive diagrams. An equal range of technologies was used to ensure accessibility on legacy or enterprise systems, tailored for mobile use, and optimised for modern desktop browsers.
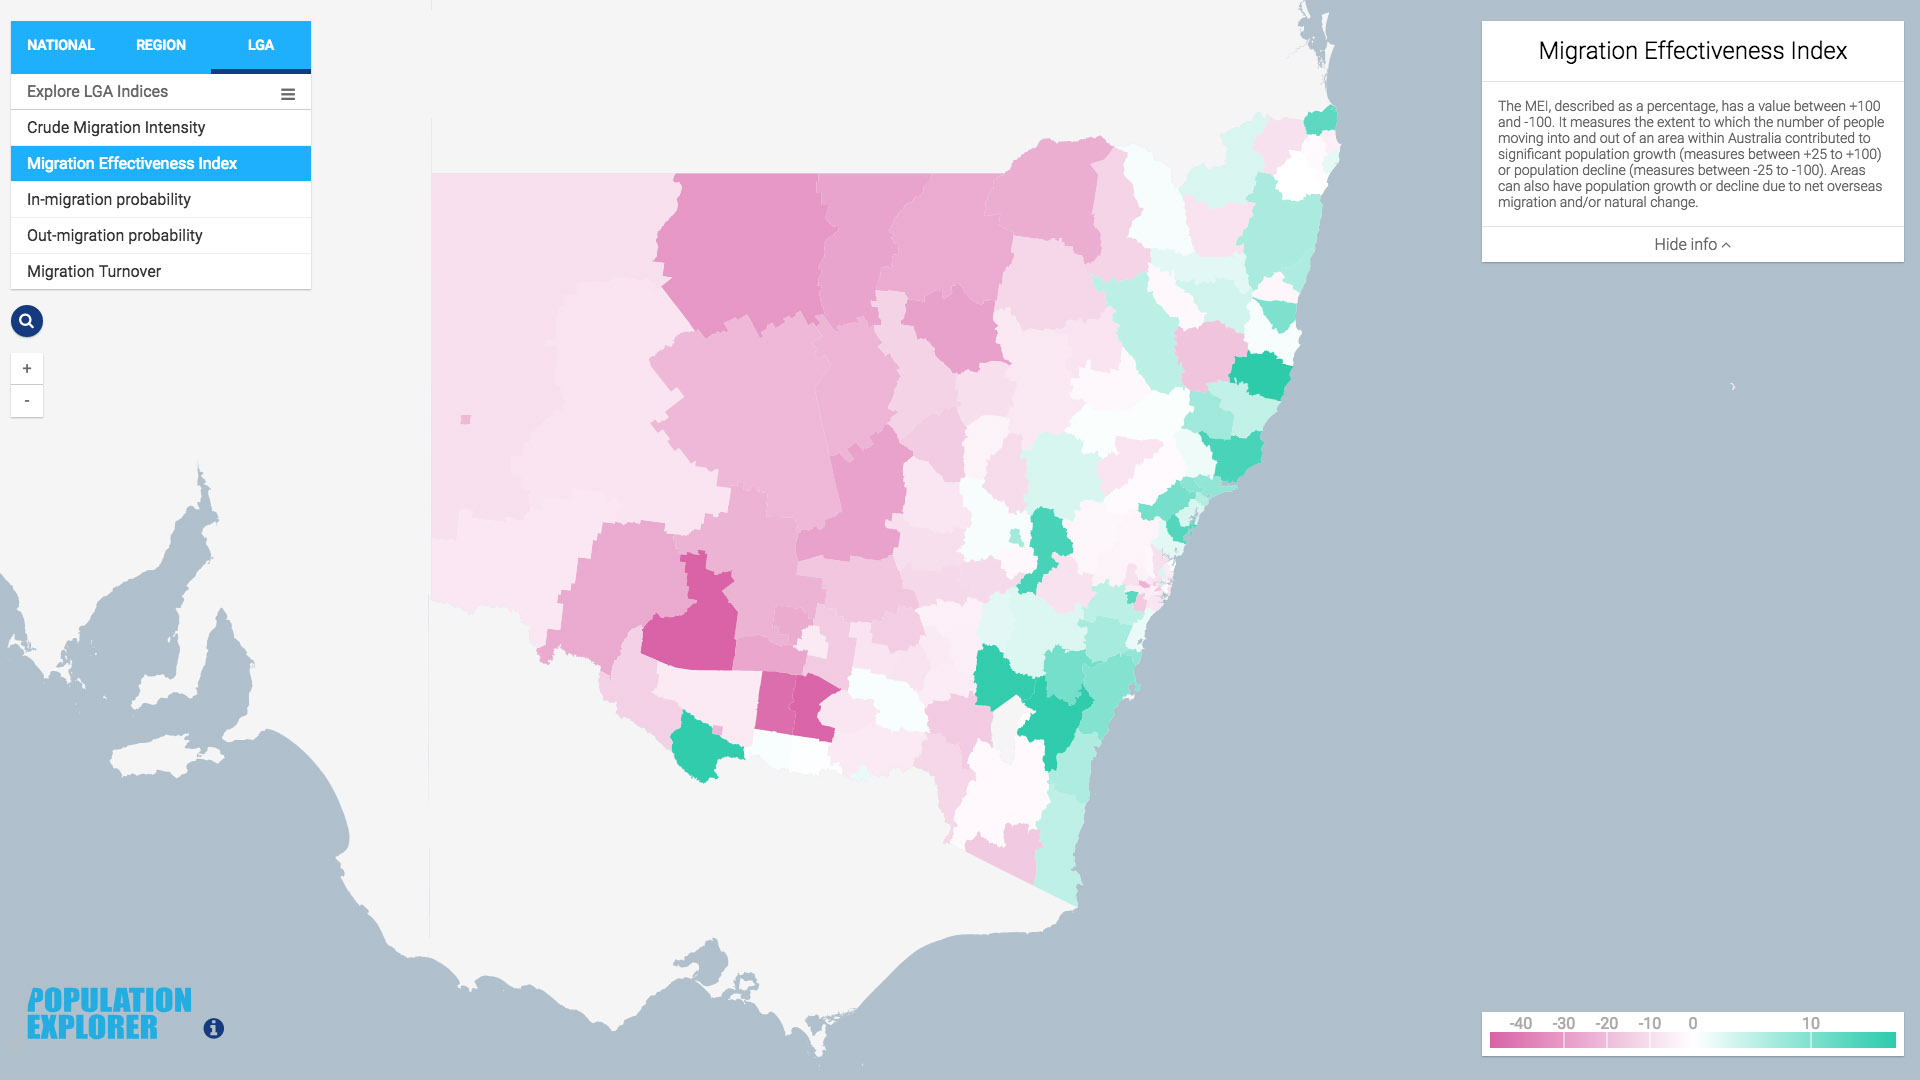
Migration Explorer
A further development project built on the BTS work for the Department of Planning and Environment, examining migration of populations in and out of NSW. An advanced interactive tool to zoom into local areas and see trends at that scale, or zoom out to reveal macro patterns.
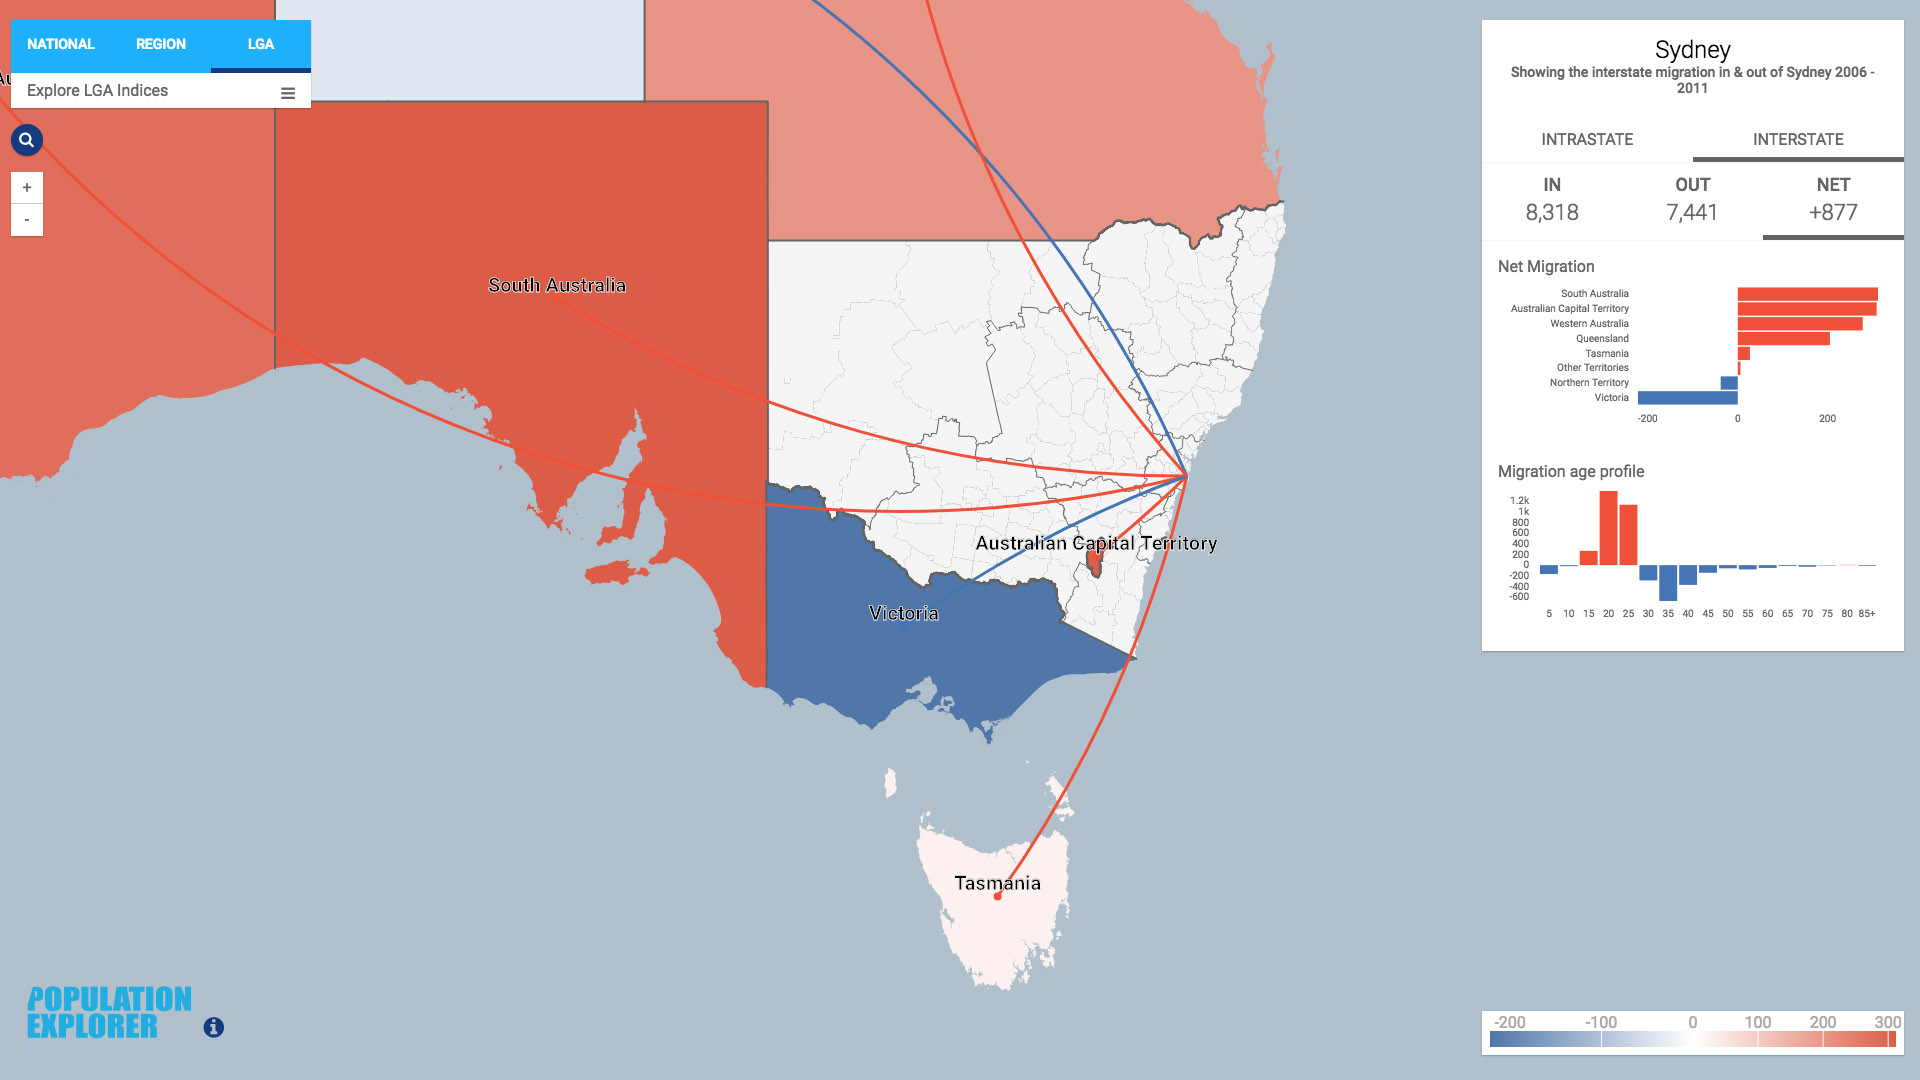
Each LGA (Local Government Area) can be interacted with to see the flows in, out, or net values.
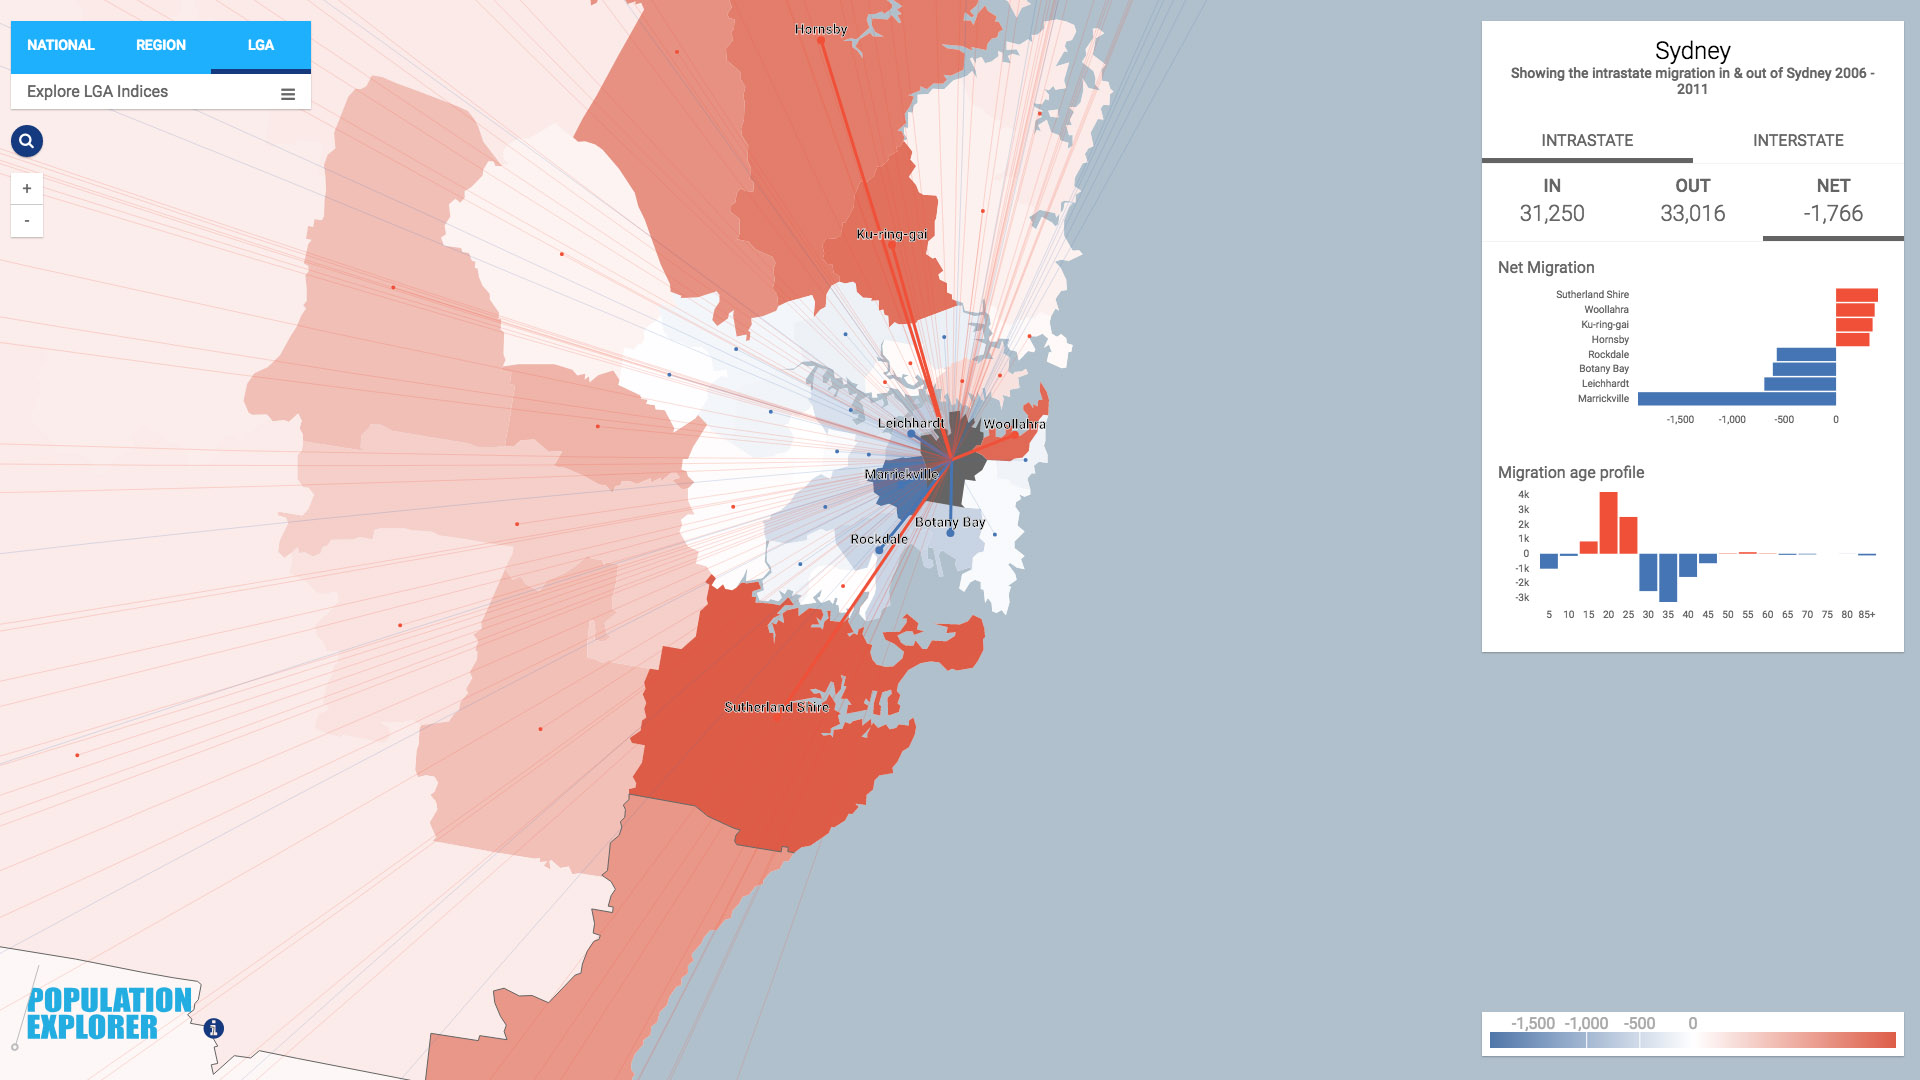
The interface also enables a series of indices to be overlaid across the state of NSW.